Green Roof Map: See Every Green Roof Around Your Site
Planning officers and drainage engineers keep asking the same quiet question: is anyone actually building green roofs around here? Our green roof map answers it for any site in England. Give us a site boundary and we survey everything within 500 metres — every building checked against aerial imagery, satellite data, open London surveys and planning records — and return the green roofs found, their combined area, and how the neighbourhood's uptake compares with London averages. It turns a vague sustainability claim into a measured piece of evidence for a SuDS strategy or flood risk assessment.
Why green roofs around your site matter to your application
A green roof on your own building is a design decision. Green roofs on the buildings around you are evidence — and evidence is what planning runs on.
Drainage policy asks developers to manage rainfall as close to the roof as possible, and lead local flood authorities increasingly expect roof-level source control to be considered before anything else. In London, the urban greening policies of the London Plan push the same way. When your SuDS strategy proposes a green roof, a survey showing fifteen established green roofs within a five-minute walk tells the officer this is normal practice for the area, not an experiment. And when the neighbourhood shows nothing at all, that's worth knowing too — the strategy can lead with policy support rather than local precedent, and nobody is surprised at committee.
There's a second use we didn't expect when we built the tool: roof-level context for existing-runoff baselines. If the site itself already carries a vegetated roof, the drainage calculations should reflect it — and our survey flags that before the topographic survey does.
What the survey shows
Every building footprint in the study area is classed on the strength of the evidence:
-
Confirmed — at least two independent evidence lines agree, one of them from imagery. These are the roofs you can safely cite.
-
Likely — one strong line: a clear vegetated signature, an open survey polygon, or a mapped roof tag.
-
Possible — a single marginal signal, mapped for completeness but never counted in the statistics. Some will be trees over buildings; the survey says so.
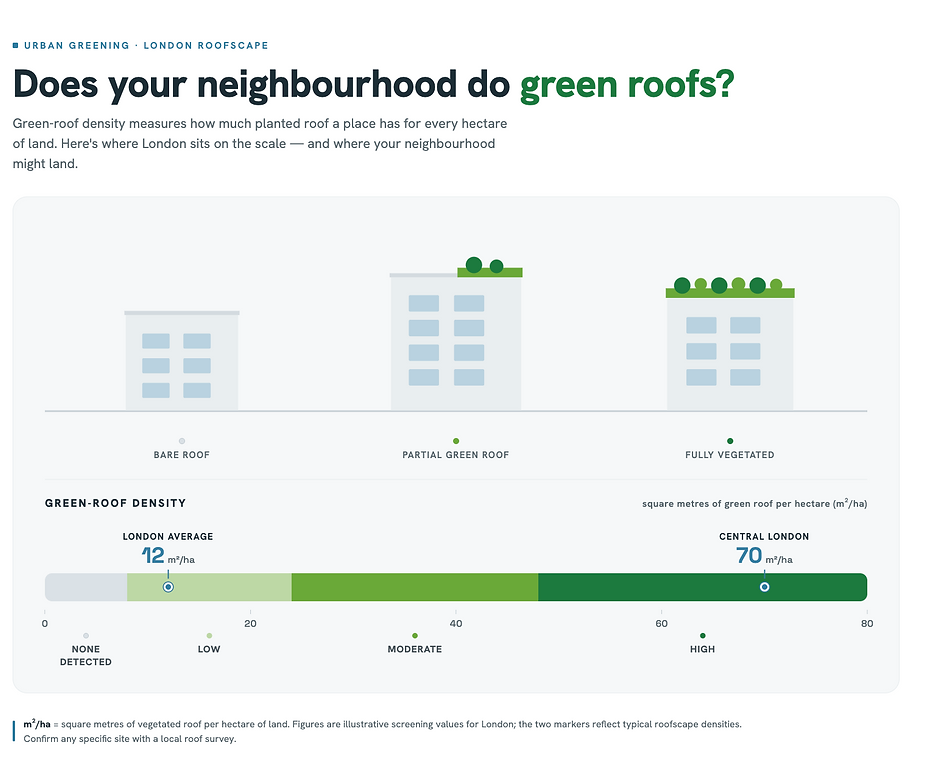
The detected area is then benchmarked. Greater London averaged roughly 12 m² of green roof per hectare in the 2021 London-wide survey, and the central London CAZ about 70 m²/ha — your study area lands somewhere on that scale, banded High, Moderate, Low or None detected. Alongside the classes, the survey reports roofs that appear newly greened since about 2019 (from satellite change detection) and planning consents mentioning green roofs in the last seven years — the two signals that show where uptake is heading, not just where it's been.
The result arrives as a map in our house style — every detection outlined, the site in red, the numbers in the legend — plus an evidence register listing what supports each roof.

How we find green roofs
No single dataset can do this, so the survey cross-examines six. High-resolution aerial imagery is scored for roof-level vegetation — with tests that reject the classic impostors: trees overhanging a shed, bright verdigris copper, moss on tiles. Sentinel-2 satellite data adds a true infrared vegetation signal for larger roofs, compared against a 2018–2020 baseline to spot new installations. OpenStreetMap contributes mapped roof tags. Two open London surveys — the GLA's central-London mapping and the 2021 London-wide academic survey — corroborate. And planning registers supply the consents. Sources must agree before a roof is Confirmed; when they contradict each other, the survey says "verify" rather than guessing.

What each result means for you
High uptake — roof-level greening is established local practice. A green roof proposal slots into the neighbourhood story, and your SuDS strategy can say so with numbers and a map.
Moderate uptake — above the London-wide average. Precedent exists; cite the nearest examples and their distance.
Low uptake — green roofs are present but scarce. The strategy leans on policy rather than precedent — which is fine, and better discovered now than in a committee report.
None detected — no reliable green roofs found. Note that small domestic roofs can evade open data, so we say "none detected", not "none".
An honesty note, as always: this is an indicative desk survey, built from open data. It is designed to evidence context, not to certify individual roofs — anything your argument leans on gets verified on imagery or planning records first.

Is there a map of green roofs in London?
Two open datasets exist: the GLA's survey of central London (mapped from 2015 imagery) and a 2021 academic survey covering all of Greater London. Neither tells you what's around a specific site today, which is what our survey adds — it combines both with current imagery, satellite data and planning records for your actual study area.

How many green roofs are there in London?
The 2021 London-wide survey measured about 1.89 km² of green roof across Greater London — roughly 260 football pitches — with about 0.23 km² in the central Activities Zone. Uptake has grown since, so treat those as a floor rather than a count.
Do green roofs count as SuDS?
Yes — they sit at the top of the drainage hierarchy as source control. An extensive green roof typically retains a substantial share of annual rainfall and slows the rest, which reduces the attenuation storage the rest of the site has to find. They also score on water quality, amenity and biodiversity — the four SuDS pillars.
Can't I just look at Google Maps?
You can see individual roofs on aerial views, but you can't measure a neighbourhood that way — greenery on a roof might be a tree beside it, imagery ages, and there's no register behind the pixels. The survey classifies every building with evidence you can put in front of an officer.

Will a green roof help my planning application?
It helps the drainage case wherever SuDS policy applies, and in London it contributes to urban greening expectations. What the survey adds is context: whether your proposal follows local precedent or sets it. Both are workable positions — they're just argued differently.

Get in Touch
Send us your site address or boundary and we'll run the survey — the map, the numbers, the nearest examples and the consented pipeline, explained in plain English and ready to drop into a flood risk assessment or SuDS strategy.
Get in touch to discuss your site and receive a quote.
.webp)