How Our Groundwater Flood Risk Model Works
This page sets out the methodology behind our groundwater flood risk model — the datasets it uses, the hydrogeological logic it applies, how the four risk classes are derived, and where its limits lie. We publish it because groundwater screening results are only as credible as the method behind them, and because planners, architects and reviewing officers are entitled to ask "how do you know?". If you're after the plain-English version, start with our groundwater flood risk map page.
Purpose and standing
The model is an **indicative screening tool**. For a given site boundary it estimates the likelihood, severity and uncertainty of groundwater flooding and assigns one of four classes — High, Medium, Low or Negligible. It is designed to prioritise sites and areas for further assessment, in the same spirit as the national screening products used across the industry. It does not replace site-specific investigation, and in planning work it supplements — never overrides — the borough's Strategic Flood Risk Assessment, which remains the policy authority.

The two mechanisms the model represents
UK groundwater flooding research consistently identifies two dominant mechanisms, and the model treats them separately.
### Clearwater flooding in consolidated aquifers
In Chalk, limestone and sandstone country, months of sustained recharge can raise the water table until it reaches the land surface — reactivating dry valleys and feeding springs that flow for weeks. The benchmark events are the winters of 2000/01, 2013/14 and 2023/24, when Chalk index boreholes rose by more than 25 metres and valley communities from Sussex to Dorset flooded for months. Research on these events (Macdonald et al. 2008; Hughes et al. 2011) shows the flooding concentrates in valley bottoms — which is why the model weights topographic position, not just geology.
### Permeable superficial deposits flooding
River terrace gravels and alluvium — much of the Thames corridor through London — sit in direct hydraulic continuity with rivers. When river levels run high, groundwater rises through the gravels and can flood low-lying ground behind flood defences, before any river water overtops. The Oxford floods of July 2007 are the studied archetype (Macdonald et al. 2012). The model flags this mechanism where permeable superficial deposits lie within a set distance of a watercourse.
Rebound of suppressed water tables (for example, the confined Chalk beneath central London), mine water recovery and spring-flow anomalies are **excluded**, consistent with the scope of the established national maps, and flagged contextually where relevant.
The datasets
The model incorporates national-scale open datasets, each fetched live for the site in question:
- **Terrain**: Environment Agency LiDAR 1 m Composite Digital Terrain Model, with Ordnance Survey Terrain 50 as fallback — ground levels, valley-bottom position and slope.
- **Geology**: British Geological Survey 1:50,000 geological mapping — bedrock and superficial units, from which permeability and aquifer character are classified.
- **Hydrogeology**: BGS 625k hydrogeological mapping — aquifer productivity and flow mechanism.
- **Groundwater levels**: Environment Agency groundwater monitoring records (the national groundwater level network), analysed station by station for record length, seasonal range and extreme levels.
- **Borehole evidence**: BGS borehole archives, including digitised ground investigation records with logged **water strikes** and standing water levels near the site — direct, local evidence of the shallow water table.
- **Flood history**: the Environment Agency's recorded flood outlines attributed to groundwater — around 1,600 mapped groundwater flood events nationally — used for corroboration and validation.
- **Watercourses**: OS Open Rivers and the statutory Main River network, for the river-continuity test and base-level estimation.

From data to depth-to-groundwater
The engine builds a screening grid over the site and its surroundings, then estimates a *high-stand* groundwater level for each cell — the level expected in an extreme wet period, on the industry's 1% annual probability convention. Evidence is applied in a strict hierarchy: local water-strike evidence governs where it exists; a river base-level model fills gravel areas beyond it; and monitoring-station statistics are used only where the station's regime plausibly transfers to the site. Deep or confined signals — for example, boreholes monitoring the confined Chalk far below London's clay — are filtered out rather than allowed to distort the shallow picture.
Subtracting the estimated groundwater surface from the LiDAR ground level gives a **depth to groundwater** for every cell, and the classes follow from thresholds with published precedent: emergence at the surface marks the top class; within about 2 metres of the surface is the zone BGS's national susceptibility work treats as most susceptible, and matches the criterion used in London's strategic groundwater mapping; and 5 metres is the conventional screening floor, below which basements and services rarely reach.

The four classes, and confidence
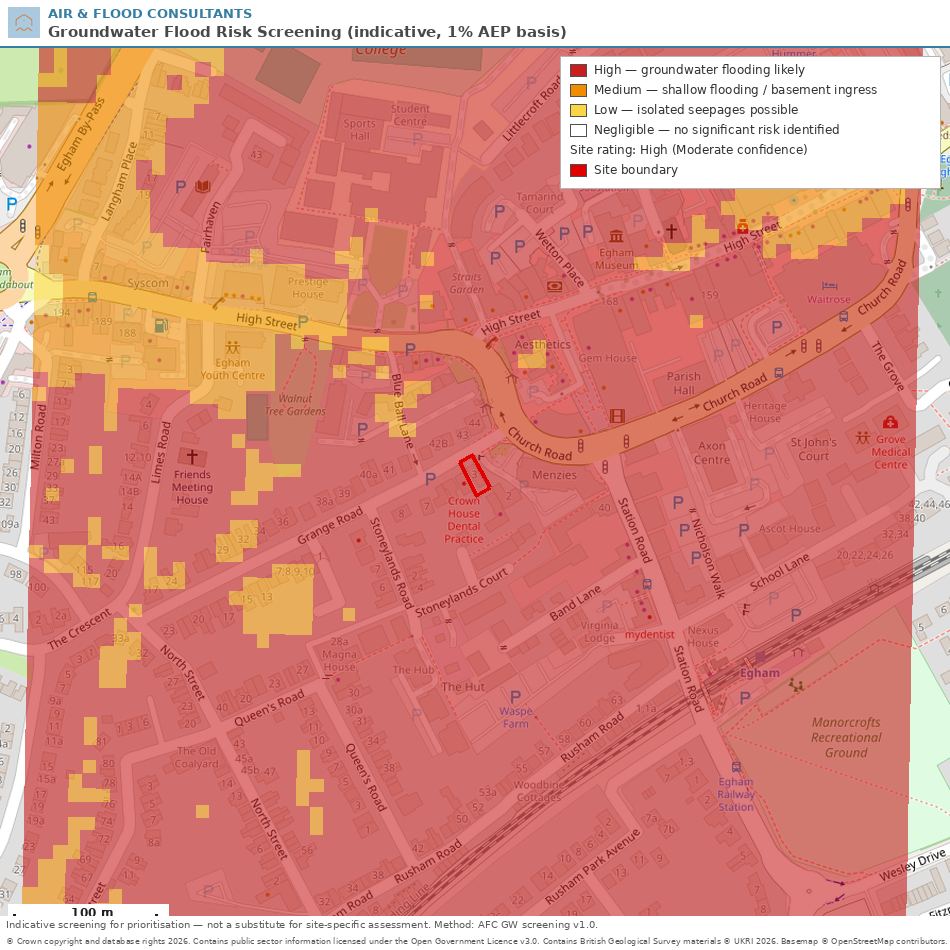
- **High** — modelled emergence at the surface **plus** corroboration: a valley-bottom or ponding position, river-connected gravels, or recorded groundwater flooding nearby. Emergence alone is not enough — a screening tool that cries High everywhere helps nobody.
- **Medium** — groundwater within about 2 metres of the surface: shallow flooding and basement ingress become realistic during high water table conditions.
- **Low** — groundwater between roughly 2 and 5 metres: isolated seepages and impacts on deep structures, soakaways and services.
- **Negligible** — no susceptible geology, or groundwater reliably deeper than 5 metres.
Every result also carries a **confidence rating** — driven by how close the real evidence is (water strikes, matched monitoring stations, recorded events) and by proximity to mapped geological boundaries. Uncertainty is reported openly rather than hidden inside the class, following the practice of the BGS susceptibility dataset.

Validating the groundwater flood risk model
Three checks stand behind the output. First, class semantics follow the conventions of the established national products, so results read consistently with the screening maps used in property and planning due diligence. Second, every run reports recorded groundwater flooding near the site from the Environment Agency archive — where the model and the historical record disagree, the record wins the argument and the confidence rating says so. Third, bench tests: documented groundwater flooding areas should and do screen High or Medium, while clay uplands with no permeable cover screen Negligible.

Limitations — stated plainly
No screening model survives contact with a site investigation unmodified, and honest limits matter more in groundwater work than anywhere else. The model interpolates from sparse monitoring records rather than running a national recharge model; its estimates are weakest away from boreholes and off the Chalk. Groundwater "return periods" are softer than their river equivalents, because level records are short and strongly influenced by preceding seasons. Engineered influences — pumping, deep drainage, sewers, existing basements — are not modelled. Recorded flood archives under-report groundwater, so an absence of history is weak evidence of absence. And mapped geology at 1:50,000 blurs boundaries that matter at plot scale, which the confidence rating reflects but cannot cure. For all of these reasons the output is a screening class, not a design groundwater level — the design level comes from site-specific assessment with monitoring where the class warrants it.

I'm planning a basement. What depth to groundwater is a problem?
As a rule of thumb, groundwater within about 2 metres of the surface is a live design issue for basements, and anything within 5 metres deserves attention for deeper structures and drainage. Between those depths the answer depends on geology and season — which is why Medium and Low results recommend monitoring before design.

Key references
The methodology follows the published UK evidence base, including:
Macdonald et al. (2008), *Improving the understanding of the risk from groundwater flooding in the UK* (FLOODrisk 2008);
Hughes et al. (2011), *Flood risk from groundwater*, Journal of Flood Risk Management;
Macdonald et al. (2012), *Groundwater flooding within an urbanised flood plain* (the Oxford 2007 study);
McKenzie & Ward (2015), *Estimating numbers of properties susceptible to groundwater flooding in England*, BGS OR/15/016;
and the Environment Agency's *Rapid evidence assessment of groundwater flood risk management in England* (FRS19217, 2021).

What does a 1% annual probability mean for groundwater?
It's the industry convention borrowed from river flood mapping: the class describes conditions with roughly a 1-in-100 chance in any year. For groundwater it should be read more softly than for rivers — level records are shorter, and one wet winter primes the next.

Why does my site screen differently from a commercial groundwater map?
Different models, thresholds and input vintages produce different classes near boundaries — that's inherent to screening. Where two screenings disagree, the resolution is evidence: borehole records, monitoring and geology at the site. That's the assessment we do when it matters.
What is clearwater flooding?
Groundwater flooding in productive aquifers such as Chalk, where the water table itself rises above the ground surface after prolonged recharge — clear, cold water that can flow for weeks. It's distinct from gravel flooding, where high river levels drive groundwater up behind defences.

Can the model give me a groundwater level for design?
No — and neither can any national map. The screening tells you whether groundwater needs designing for; the design level comes from site investigation and monitoring, which we specify and interpret as part of a groundwater flood risk assessment.

Get in Touch
If your site needs its groundwater risk assessed — or challenged — we do both: screening for every flood risk assessment we prepare, and full groundwater assessments with monitoring where the risk class warrants it.
Get in touch to discuss your site and receive a quote.
.webp)